Its very tempting to =jump to GenAI= now for all kind of problems, but before GenAI was there, there were these cute simple algorithms which did the work with quite nice bit of accuracy. The downside was that they needed data to be trained on first, and with GenAI we work with pre trained model (foundation models). So if you have data, and the use case is to classify, and you dont want to shell out huge computation and monetary resources, then ML models such as decision tree is a good bet.
What is the The core idea of a decision tree?
A decision tree tries to repeatedly answer:
“Which single feature + threshold splits the data into the purest groups?”
Let’s figure out with an Example:
For all further explanation we will be referring to a hypothetical dataset of user engagement with 3 Simple Features and the Target is to determine Churn.
| Feature | Meaning |
|---|---|
| DaysSinceLastUsed | How many days since the customer last logged into the product |
| AvgWeeklyMins_Lifetime | Average weekly active minutes over the whole customer lifetime |
| AvgWeeklyMins_LastMonth | Average weekly active minutes over the last 4 weeks |
| Churned | Yes/No — target label |
What does a decision tree want to do in this churn scenario?
It wants to repeatedly answer:
“Which one simple business rule splits customers into the clearest churn/non-churn groups?”
Examples of such rules:
-
“If DaysSinceLastUsed > 30 days → high churn risk”
-
“If AvgWeeklyMins_LastMonth < 15 → high churn risk”
-
“If engagement dropped (last month < lifetime avg) → potential churn”
A tree is just a system that keeps discovering these rules automatically.
The Tree’s First Task: Find the most useful split
A decision tree looks at every feature and asks:
“If I split on this feature, do I separate churners and non-churners cleanly (purely?”
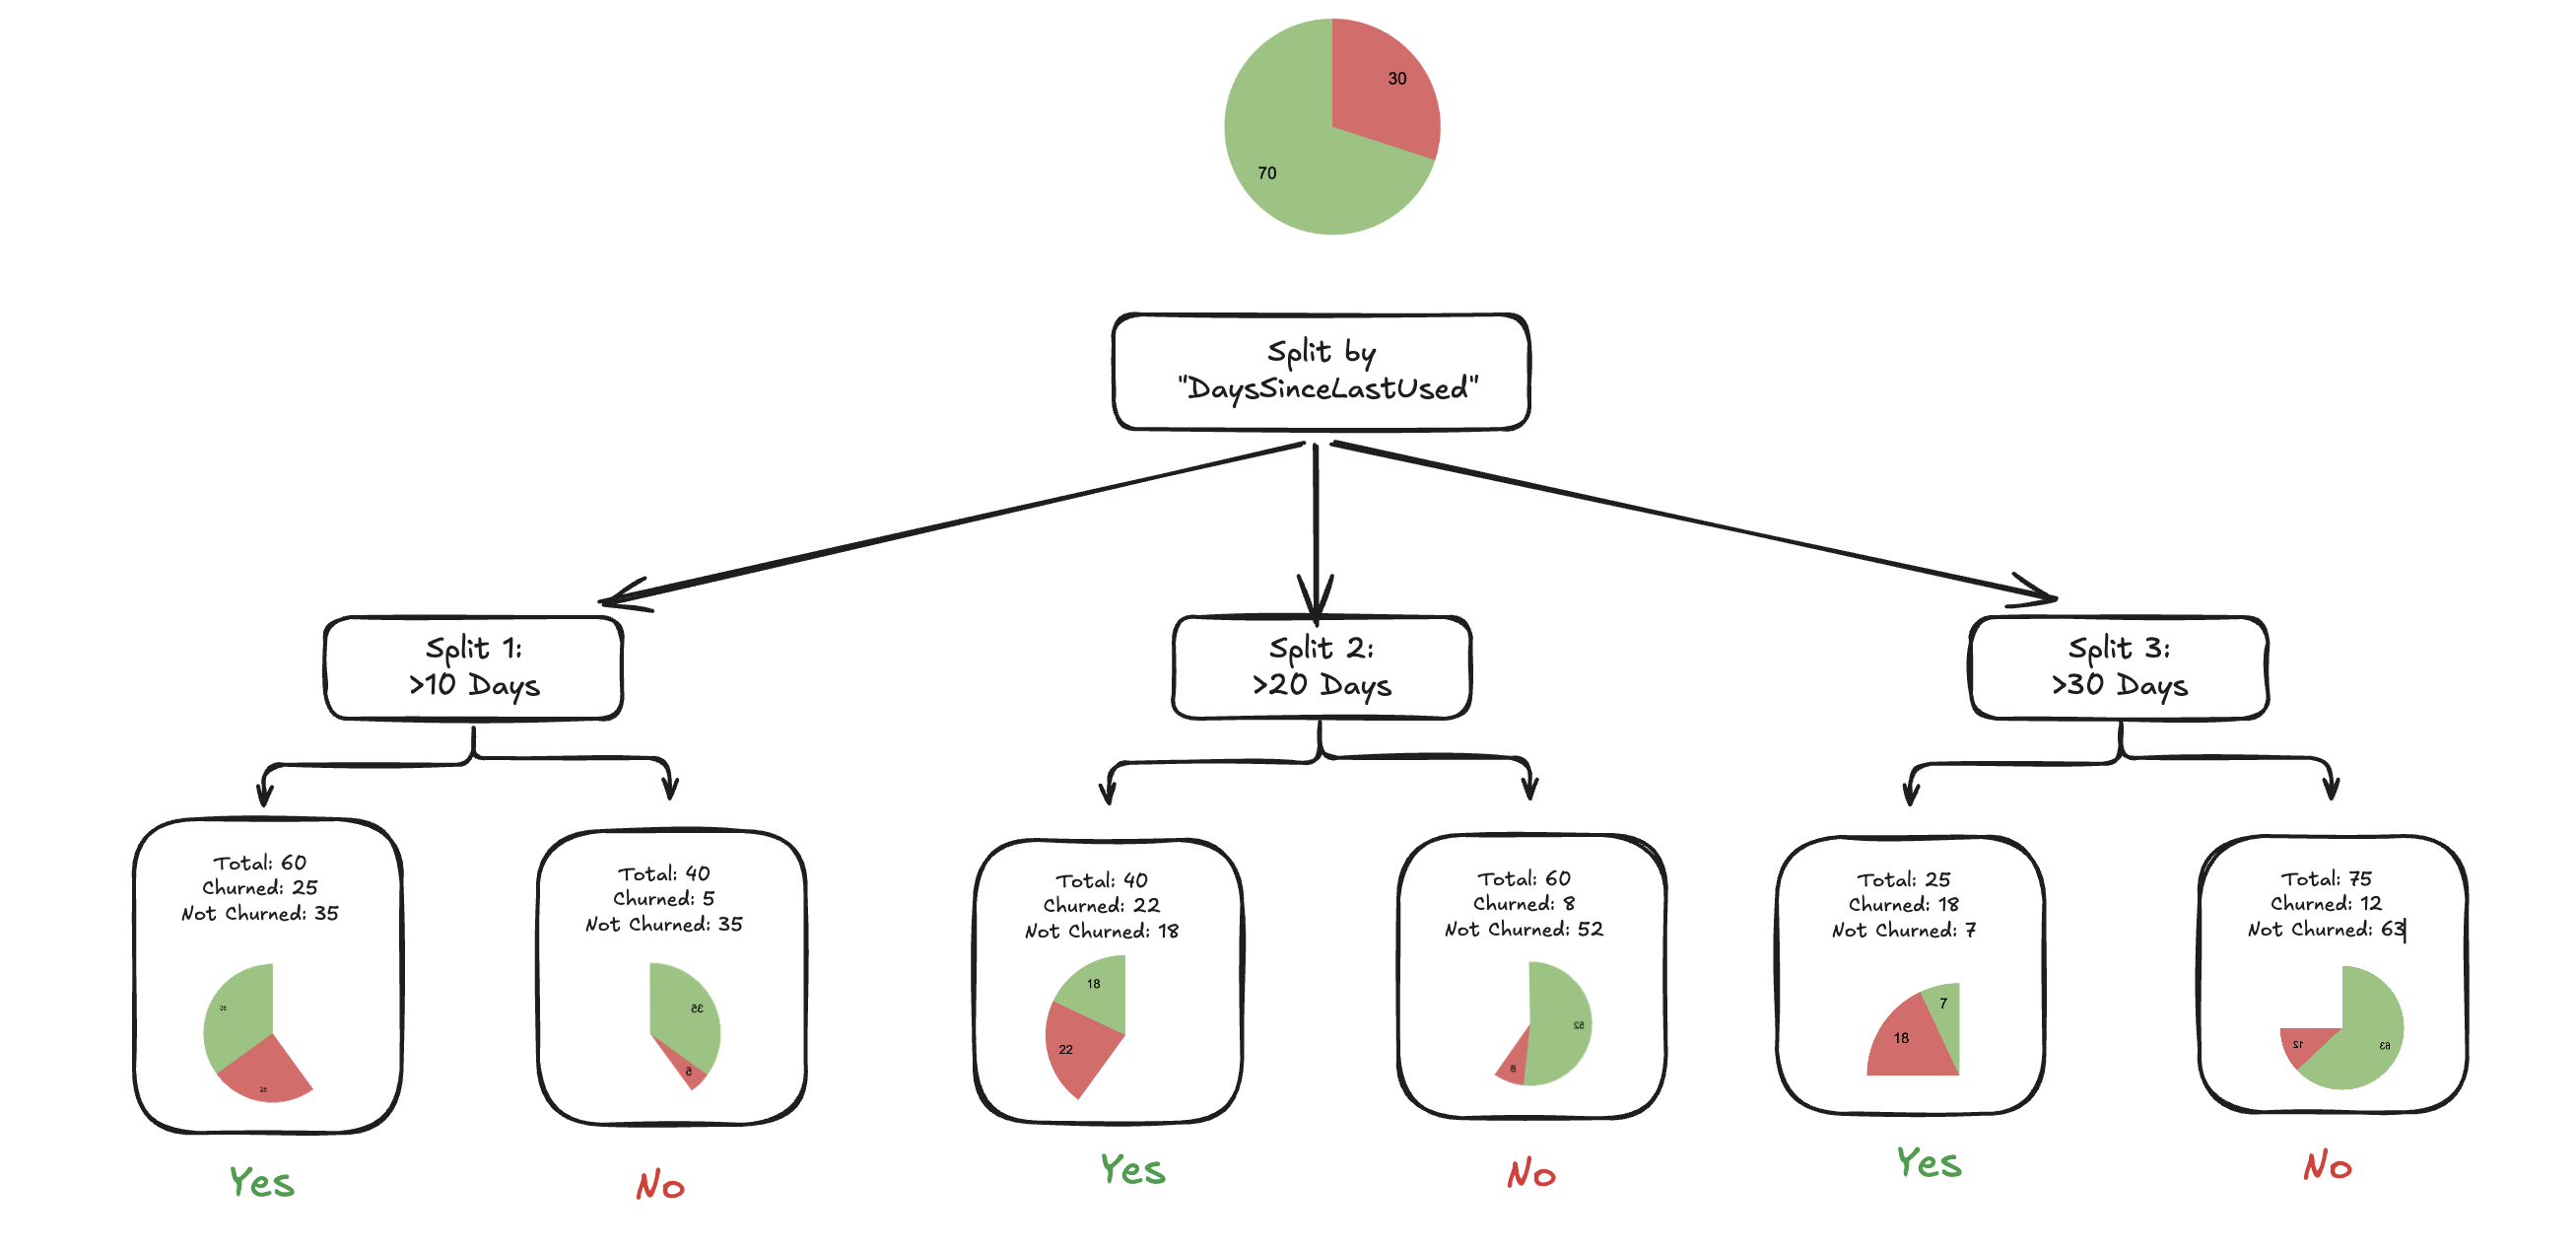
Let’s start with one feature: DaysSinceLastUsed
Try splitting by DaysSinceLastUsed
Possible business rules it considers:
-
“If last used > 10 days”
-
“If last used > 20 days”
-
“If last used > 30 days”
-
…
For each possible threshold, the model checks:
Do customers on each side behave differently in churn outcomes?
If one side becomes “mostly churned” and the other “mostly not,” the split is good.

So If we look at the churn/total for each bucket
| Condition | YES Bucket (Churn/Total) | NO Bucket (Churn/Total) |
|---|---|---|
| >10 days | 25/60 | 5/40 |
| >20 days | 22/40 | 8/60 |
| >30 days | 18/25 | 12/75 |
We want:
Which Split creates the cleanest separation between churners and non-churners
Enters the concept of ==Gini== and ==Entropy==.
1️⃣ What is Gini?- “How often would I be wrong?"
Gini asks
If I randomly pick two customers from this group, how likely are they to belong to different classes?
- High Gini = very mixed group -> bad split
- Low Gini = pure group -> great split
When a bucket is 50/50, Gini is at worst, When a bucket is all churn or all non-churn, Gini = 0, known as ==perfect purity==
2️⃣ What is Entropy — “How much disorder is in this bucket?”**
Think of entropy as:
How unpredictable is this group?
-
High entropy → the label is random, uncertain
-
Low entropy → you can predict churn with high confidence
Entropy is highest when:
- 50% churn / 50% not churn
→ “maximum uncertainty”
Entropy goes to zero when:
-
Everyone churned
-
or everyone stayed
→ “no uncertainty”
3️⃣ What is Information Gain — “How much uncertainty did the split remove?”
Information Gain flips the thinking:
Instead of measuring impurity, it measures improvement.
Information Gain = (Parent impurity) – (Weighted impurity of children)
Meaning:
-
A great split dramatically reduces uncertainty
-
A bad split barely improves (or worsens) uncertainty
Information gain is calculated by the ==gain== in ==Gini== (purity) or ==Entropy== (Uncertainity)
Decision tree calcultes the gain or loss at each split and pick the
- Split at Lowest Gini (if Gini is used)
- or Lowest Entropy (if Entropy is used)
Well this raises more question than it answers:
- How are the initial split determined, how is the next split determined?
- How to know where to stop?
- How does this propagate for other features?
We will try to explore them in part 2.
Lets get into the maths a bit
You can skip this section. and go to Part 2
Step 1 : Parent Impurity
Across all 100 customers
- Total Churned = 20
- Total Not Churned = 80 so
- $p_c$ (Churn) = 20/100 =0.2
- $p_n$ (Not Churn) = 80/100 =0.8
p(x) ~ probability of x happening
Parent Gini
$$ G = 1 - (p_c^2 + p_n^2)$$ $$ G = 1- (0.2^2 + 0.8^2) = 1- 0.68 = 0.32 $$
Parent Gini = 0.32
Parent Entropy
$$ H = -p_clog_2(p_c) - p_nlog_2(p_n)$$
[!info] Why multiplying probability with log (probability) measure uncertainity? Claude Shanon intorduced information theory in 1948
$$ H= -0.2 \times log_2(0.2) - 0.8 \times log_2(0.8) $$ $$ H = 0.7219 $$
Parent Entropy = 0.7219
Now for each split, in similar ways Gini or Entropy is calculated and the gain is measured to check if this is a viable split.